The risk of contracting Lyme disease depends on where you live or visit. The best way to determine an area’s risk is to look at a map. However, maps from different sources vary. For example, the CDC Lyme disease surveillance maps show exposure as primarily limited to the East Coast, but other sources suggest a much broader geographic risk of exposure—particularly in the South and the West.
At our last board meeting, I presented information about how different sources map Lyme disease, which we taped. You can watch that video, by clicking the arrow below.
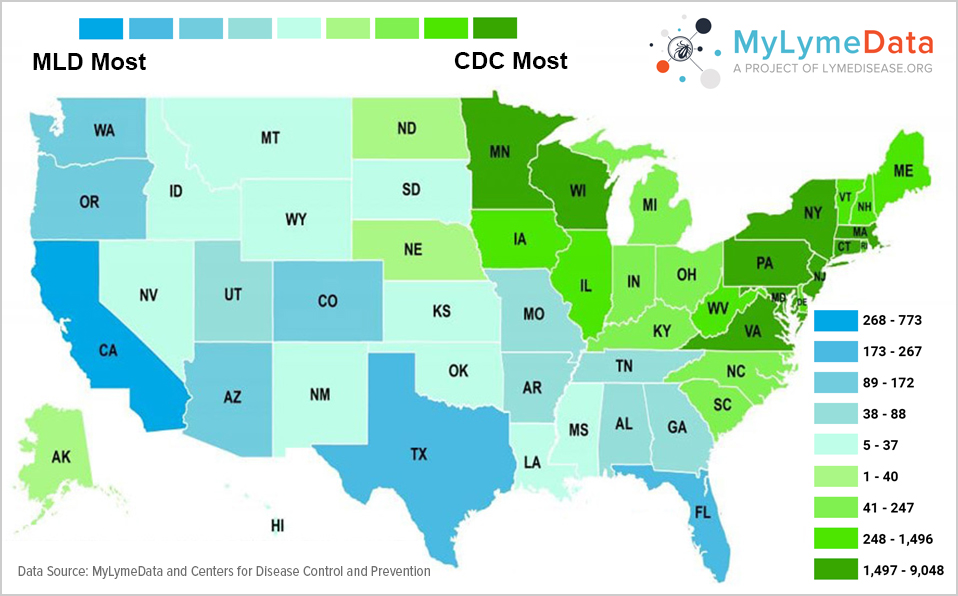
I'm going to present some information that we're just beginning to pull together from MyLymeData called mapping MyLymeData. So what we started to do was we thought it would be interesting to take the MyLymeData cases and look at them compared to how they were distributed across the United States. So this shows you that we've got cases that have been reported throughout the United States. Yeah, we're a little bit dominant in California, which is to be expected because lymedisease.org started off as a California organization, so we have a greater concentration of cases here, but otherwise we're very much distributed throughout the United States and we compared it to this map of CDC total cases. And I'm working with this really sort of wonderful map maker.
Her name is Suzanne, and she put this map together for me and I asked her specifically to take the states where there was zero cases and make them gray because usually you see this sort of a map, and it actually would show as like a green whereas the CDC says, "No, actually, there are no cases of Lyme disease in Colorado, New Mexico, Oklahoma, or Arkansas." And so when I was at ILADS last year, I asked ILADS if they would share with me their physician referrals, and they were kind enough to do that. And we were talking about the difficulty of getting early diagnosis and particularly in states where people say, "Well, there's no Lyme here, so they don't test you, they don't look for it, and you don't get diagnosed, and you don't get treated."
And what we were focusing in on here was this case that was coming out of Colorado that was picked up by CBS News and over a 10-year period, the CDC reported in Colorado, 12 cases. We had 85. The tick bites, seen as those people who are in MyLymeData who actually recall a tick bite were 23, and the canine cases which are based on a rolling five-year average were 515 and the ILADS physician referral requests were 742. So the concept is when you're looking at risk factors in particular, what data should you be tracking? What's gonna give you the most reliable information about your risk exposure? So we decided to take those, the cases that we had and the CDC cases and just looked to see where we had more cases reported than the CDC had because that's, you know, we shouldn't have more cases than the CDC.
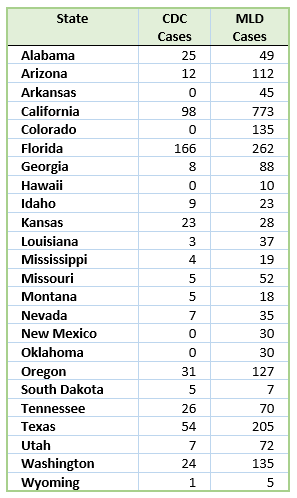
CDC's got 30,000 people that they're reporting. And this data is roughly 6000 people. So just really we ought to be a fraction of the CDC across the board, but what we found instead was that in all of these states that are indicated in blue, MyLymeData had more cases than the CDC was reporting. And what you'll notice about this map is that all of those cases are in the West and the South essentially. So we thought it would be interesting to take those 24 states and that's what it amounted to is 24 states in the South and the West, and look at all of the different data sources that we have for estimating risk.
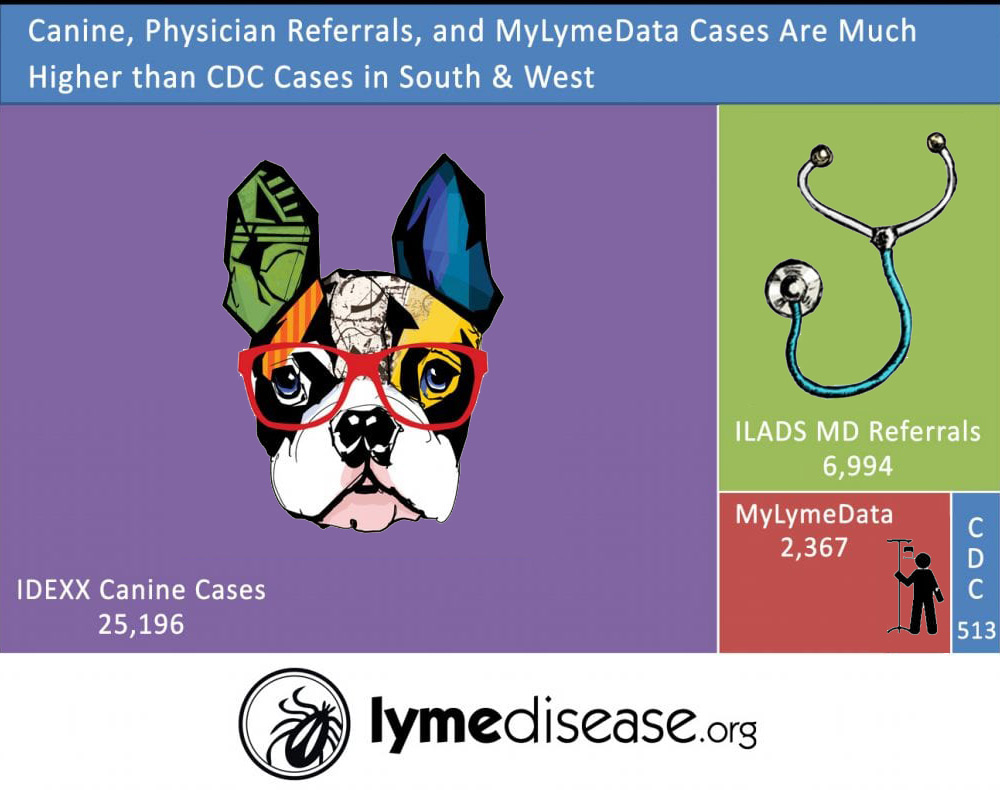
So we looked at the IDEXX Canine cases and just in the South and the West, there were over 25,000 cases reported with the canines. The physician referrals from ILADS was about 7000 cases. The MyLymeData cases were 2300. The MyLymeData tick bites recalled was 1200. And there's the CDC, off in the corner there, 513. So this is just a map that shows the MyLymeData diagnosed Lyme cases. Here is the tick bite location cases. Here's the canine cases which you can see really paint a very different picture than the CDC cases for a risk exposure. And here's the ILADS physician referral cases.
So if you put all these maps together and look at them, what you see is that all of the other sources of information besides the CDC is saying that there's a lot more Lyme in the West and in the South and it's reflected in the canine cases, it's reflected in the MyLymeData cases, and it's reflected in the ILADS physician referral cases. So we think that by putting together information like this, we can start to make the case that the CDC is systematically underreporting cases in the West and in the South and it's probably one of those vicious cycles where you say there is no Lyme in this area, therefore nobody looks for it, therefore nobody diagnoses it, nobody tests it, and the people aren't treated. And it becomes self-perpetuating.
MyLymeData & CDC Lyme Disease Maps Paint Different Pictures of Risk
When we launched MyLymeData, we decided to compare the number of Lyme disease cases reported by the CDC with the number of cases enrolled in MyLymeData state-by-state. In states that are not considered by the CDC to be endemic, the number of cases in MyLymeData surpasses those reported by the CDC.
On the map below, the states in blue have a higher number of people enrolled in MyLymeData than are included in total CDC Lyme disease case reports. (In green states, the CDC has more cases.) The differences reflected on the map suggest a broad pattern of underreporting by the CDC of Lyme disease in the South and the West.
There are some important differences in the MyLymeData and the CDC Lyme disease statistics. MyLymeData collects information from participants regardless of when they were infected, while the CDC reports are for the year 2015. However, the MyLymeData cases included in the data collected by that time was 5,776—a far smaller sample size than the CDC’s (38,069). This means that the MyLymeData sample is about one-seventh of the cases reported annually by the CDC. Ordinarily, CDC cases should surpass MyLymeData cases across the board in every state just because their sample is so much larger.
As I explain more fully in the video, this suggests that there is systemic under-reporting by the CDC of Lyme disease in southern and western states.
In total, MyLymeData participants exceed the number of cases reported by the CDC in 24 states, mostly in the South and the West. (Scroll down to see the table.)
Other Sources of Data Confirm Greater Risk of Lyme Disease in the South and the West than CDC Reports.
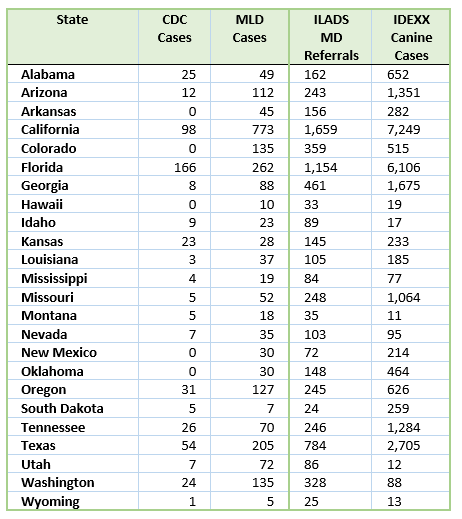
We then looked at other sources of data suggesting risk–including the number of dogs reported by IDEXX who test positive for Lyme, and the number of patients who requested physician referrals from the International Lyme and Associated Diseases Society in that state. Remarkably, we found that every one of these other sources reflected higher numbers of cases in the South and West than the CDC did—sometimes by a staggering amount. Consider, for example, the number of CDC Lyme disease cases compared to the IDEXX canine cases.
The table below shows how various data sources compare to the 24 states where MyLymeData reports more Lyme disease cases than the CDC reports.
There are, of course, other considerations that the CDC might advance–for example, some people may acquire Lyme disease while traveling to another state. However, the large number of canine cases confirm the existence of Lyme disease bacteria in all states and the geographic expansion of Lyme disease carrying ticks (now in over 50% of US counties where tick studies have been conducted) reflects a growing geographic risk. Even in an area where no black-legged ticks have been identified, the key question is not so much whether the studies indicate they are present, but whether anyone has conducted tick flagging studies in the area.
A recent big data study using insurance data claims for patients with Lyme also confirms an expanded reach. For example, North Caroline is in the top 5 states for Lyme disease related insurance claims, but it is not in the CDC top 14 states.
When we enjoy the outdoors or let pets who have been outdoors into our homes, we should be mindful of hitchhiking ticks who are looking for a blood meal and take appropriate precautions. Important points to remember:
- There are no “safe” states when it comes to Lyme disease.
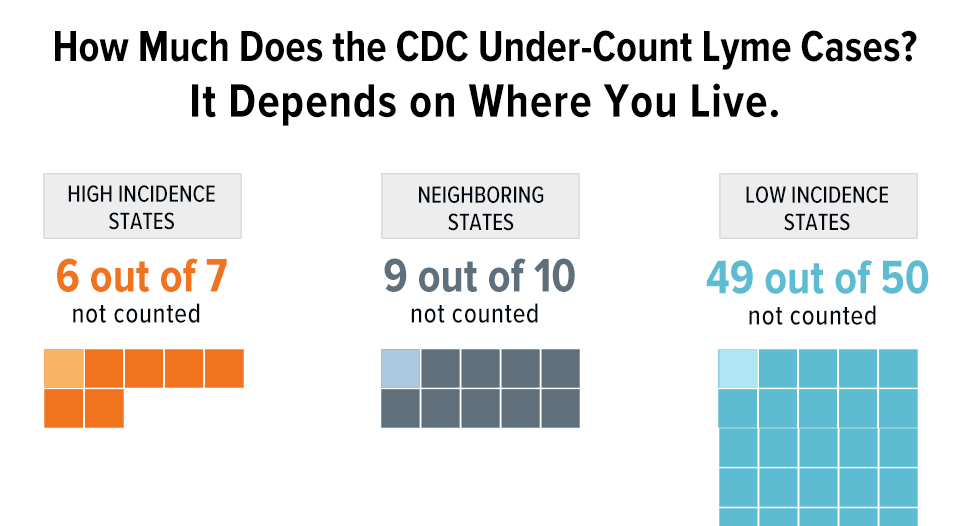
- CDC surveillance statistics underestimate the risk of Lyme, particularly in the South and West.
- The IDEXX Canine maps are the best indicator of risk in a given area.
References:
- Centers for Disease Control and Prevention, Reported cases of Lyme disease by state or locality, 2005-2015. CDC cases are the total of confirmed and probable for 2015. https://www.cdc.gov/lyme/stats/tables.html
- The MyLymeData participant data was taken from Phase 1 and a portion of Phase 2 of the survey project.
- The physician referral request data was graciously provided by the International Lyme and Associated Diseases Society.
- The IDEXX canine data is based on their 5-year rolling average data provided on their website. http://www.dogsandticks.com/map/2012/
If you are a patient who is not enrolled in MyLymeData, please enroll today. If you are a researcher who wants to collaborate with us, please contact me directly.
The MyLymeData Viz Blog is written by Lorraine Johnson, JD, MBA, who is the Chief Executive Officer of LymeDisease.org. You can contact her at lbjohnson@lymedisease.org. On Twitter, follow her @lymepolicywonk.


