I’m excited to report that the first study using information from MyLymeData has just been published in the medical journal Healthcare.
Using patient-reported outcome data from 3,900 people enrolled in MyLymeData, we looked at how individual patients vary in their response to Lyme disease treatment. Finding out who responds well to which treatments — and then learning more about those people — is an important step towards developing personalized Lyme disease treatment.
Treatment studies of patients with late/chronic Lyme disease usually take an average of how people have responded to treatment. But guess what? The average Lyme patient isn’t average! Some people improve a lot with treatment, some improve a little bit, and some people don’t improve at all. A few may even get worse.
Lyme Disease Treatment Super responders
However, if we can identify the “super responders” — the ones who did particularly well — and take a closer look at them, we may be able to learn things that can help other Lyme disease patients in a similar situation. This can help drive the development of personalized Lyme disease treatment.
For lots of diseases, such as tuberculosis, pulmonary disease, and cancer, scientists are now identifying high treatment responders, but our study is the first to use this approach in Lyme disease.
The reason it hasn’t been done before in Lyme disease is because identifying how different groups of patients respond to treatment requires large samples. The largest trial funded by the National Institute of Health for patients with chronic Lyme disease enrolled just 129 people — way too small a group to look at individual treatment variation.
So instead, they lumped all of the treatment responses together — the good, the bad and the ugly — and said how patients responded “on average.” On average, there wasn’t much improvement from treatment.
If one person gets better and the other gets worse after treatment, you can say that on average, treatment did nothing.
But treatment averages don’t tell the whole story. A famous mathematician, Des MacHale, explains it this way: The average person has one testicle and one breast. And we all know how ridiculous that is. You can’t average a male and a female like that and get any meaningful information.
Measuring Treatment Response In Lyme Disease
It’s the same thing when you measure patient treatment response in Lyme disease. If one person gets better and the other gets worse after treatment, you can say that on average, treatment did nothing. However, for the patient who got better, it made a world of difference. Yet, when we use an average to calculate treatment response, the favorable response of one patient is cancelled out by the negative response of another.
A better approach looks at variations in how different patients respond. Most Lyme disease patients already know this. Some patients get better, others get worse, and some don’t change with treatment. Treatment response variation is lost when individual responses are averaged.
Variations In Lyme Disease Treatment Response
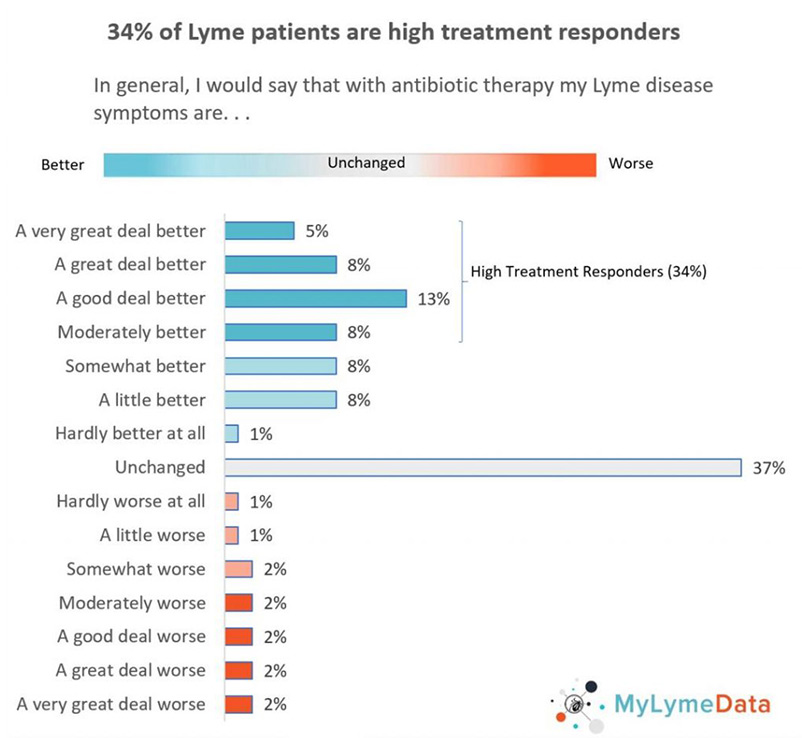
Here’s what we found. Most patients (52%) responded positively to antibiotic treatment and some — roughly a third — responded very well to treatment. These patients said that they felt moderately to a very great deal better after taking antibiotics. Very few said that they felt worse after taking antibiotics (only 12%).
If I were a patient with chronic Lyme disease — which I was by the way — I would want to know that roughly a third of those in the sample were “high treatment responders” — meaning that they reported that after taking antibiotics their symptoms improved moderately to a very great deal. This is the type of information that patients want to know and that is why we conducted this study.
This is the first of many studies to be published using the data from MyLymeData. So stay tuned! And if you are not enrolled in MyLymeData—I encourage you to stop what you are doing and sign up now. It is only by having patients pool their data that we will make progress in this disease.
MyLymeData First Published Study Results
Here is a short video I recorded explaining more about the study’s results.
Click here to read the full study.
Click here to enroll in MyLymeData.
If you are a patient who is not enrolled in MyLymeData, please enroll today. If you are a researcher who wants to collaborate with us, please contact me directly.
The MyLymeData Viz Blog is written by Lorraine Johnson, JD, MBA, who is the Chief Executive Officer of LymeDisease.org. You can contact her at lbjohnson@lymedisease.org. On Twitter, follow her @lymepolicywonk.


